Analytical dashboards
Role-aware views of the metrics that matter across sales, operations and finance.
Practical intelligence, clearly delivered
Midlands Quantum combines analytical dashboards, visualisation, predictive modelling and business intelligence into a focused system built around how your team works.
A connected analytics stack
Your dashboards, reports and models should tell the same story. We connect the layers so teams can move from a signal to an action without reconciling conflicting figures.
Role-aware views of the metrics that matter across sales, operations and finance.
Clear charts, maps and reports that make the pattern easier to understand.
Forecasts and alerts that help teams respond before a risk becomes a problem.
Trusted reporting that gives leaders a consistent view of the whole business.
01 — Analytical dashboards
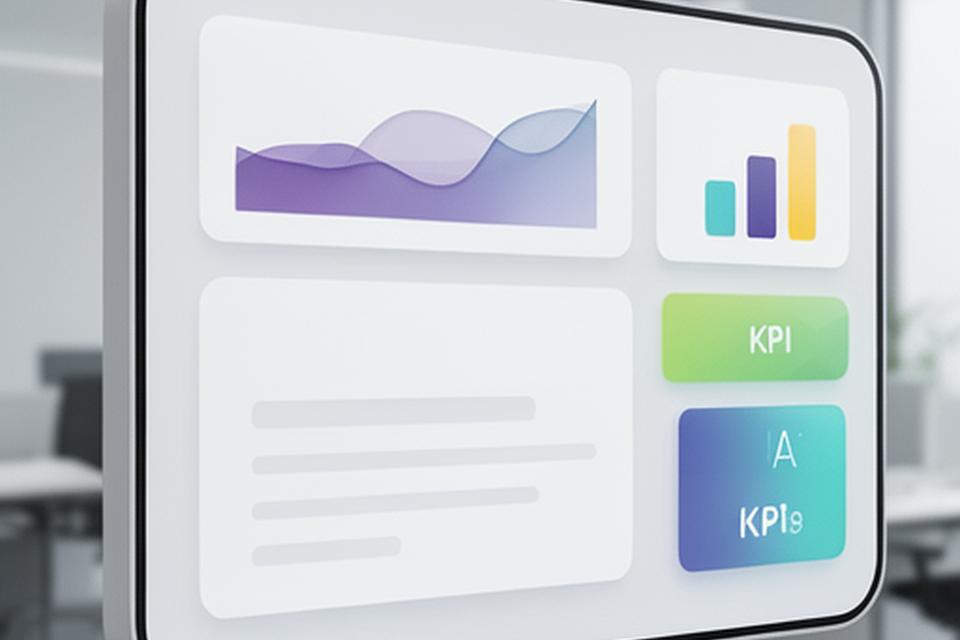
Track live metrics without hunting through tabs and spreadsheets. Every dashboard is shaped around the people using it, from directors who need an overview to teams who need operational detail.
02 — Data visualisation
Maps, heatmaps and trend lines are valuable when people can read them quickly. We make the interaction straightforward, so non-technical users can explore the detail and keep the story moving.
Spot regional performance, service gaps and territory patterns.
Build once, then share a focused web report or export a PDF.
Filter, slice and annotate data without waiting for an analyst.
Put the meaningful comparison first and reduce the noise around it.
03 — Predictive modelling
Use predictive models to estimate demand, churn and risk before they reach the monthly pack. As new data arrives, the approach can keep learning as behaviour changes.
From signal to response
Models are most valuable when their outputs appear where decisions happen. We help shape alerts and forecast views for that practical next step.
04 — Business intelligence
When CRM, ERP and spreadsheet figures disagree, leaders spend time reconciling rather than deciding. We bring those sources into a dependable reporting foundation for reviews, board packs and day-to-day management.
We support common UK business platforms, including Power BI, Microsoft 365, Xero and Sage.
A clean foundation for business-wide reporting.
The information leaders need, ready for the right cadence.
Connect the systems your teams already use.
Keep definitions consistent across teams and reporting cycles.
Choose the right starting point
Book a discovery call and we will map the right mix of dashboards, visualisations, models and reporting around your current goals.